
Part 1 of the Australia’s Productivity Puzzle series
Australia’s economy is bigger than it has ever been.
According to the Australian Bureau of Statistics, real Gross Domestic Product (GDP) has almost doubled since the start of the century.1 Even after the sharp contraction caused by the COVID-19 pandemic, economic activity quickly returned to its long-run upward trend.
If economic growth is supposed to make us more prosperous, this sounds like good news.
Yet many Australians would struggle to reconcile these statistics with their own experience. Housing affordability has deteriorated, household budgets remain under pressure, and discussions about a “cost-of-living crisis” have become commonplace.
How can an economy continue to grow while so many people feel financially stretched?
The answer begins with understanding what GDP measures, and what it does not.
The Difference Between a Bigger Economy and a Richer Population
GDP measures the total value of goods and services produced within an economy over a given period.
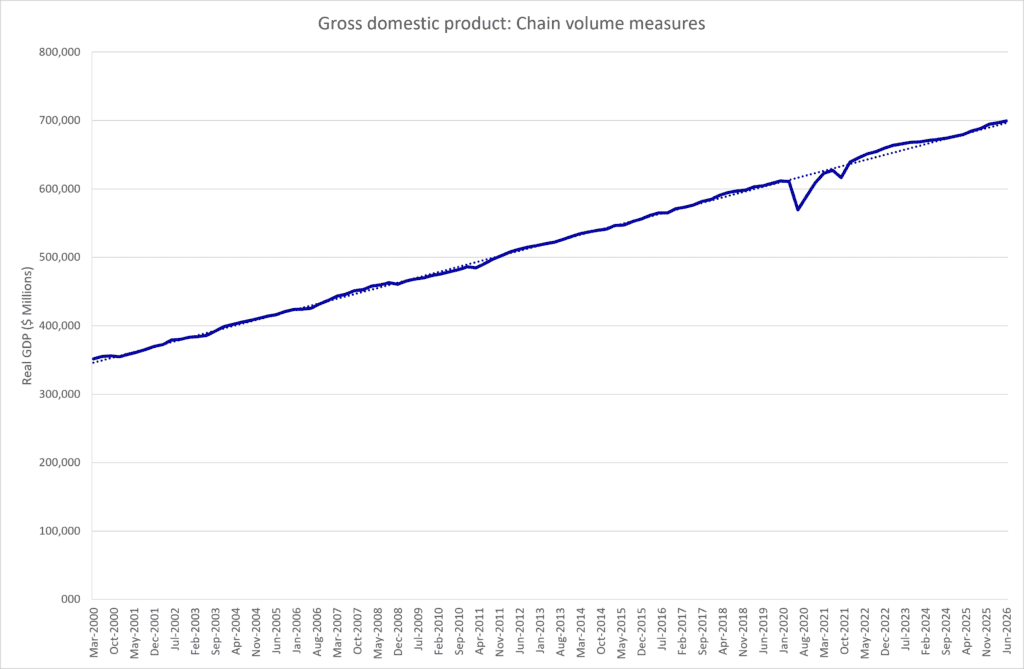
It tells us how large the economic pie is, but it tells us very little about how much pie is available for each person.
To understand living standards, economists often use GDP per capita. This measure divides total economic output by the population, providing a rough indication of the amount of production and income associated with each Australian.2
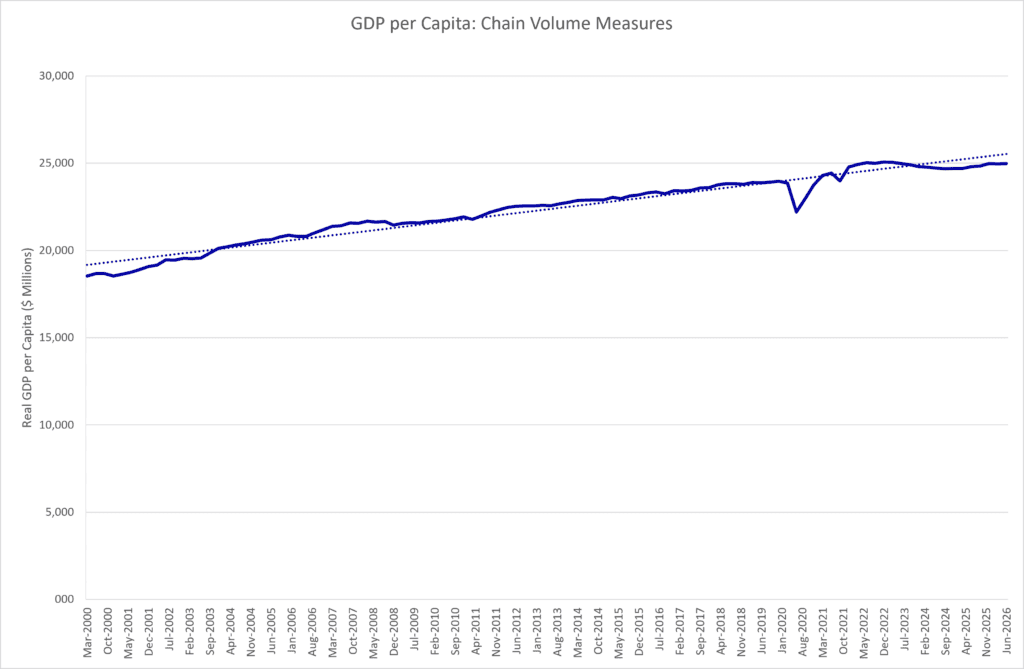
When we compare Australia’s GDP and GDP per capita over time, an important distinction emerges.
Total GDP has continued to trend upwards. However, GDP per capita has grown much more slowly, particularly since the early 2010s. Following the pandemic recovery, GDP per capita briefly rebounded before flattening once again.
This difference matters.
If population growth matches or exceeds growth in economic output, the economy can become larger without substantially improving living standards for individual Australians.
In other words, a growing economy does not necessarily mean a richer population.
Looking at the Data
The first chart in this article shows that Australia’s economy has expanded steadily since 2000. Apart from temporary setbacks during the Global Financial Crisis and the pandemic, the long-run trajectory remains remarkably consistent.
The second chart tells a more nuanced story.
GDP per capita rose strongly during the early 2000s but has shown signs of slowing over the past decade. While the economy as a whole continues to expand, output per person has increased much more modestly.
This divergence creates an important economic puzzle.
Why is total economic activity continuing to rise while the economic gains available to each person appear to be growing more slowly?
To answer that question, we need to examine productivity.
Productivity: The Foundation of Prosperity
Productivity measures how efficiently an economy transforms inputs into outputs. [2]
Although economists use several different measures, labour productivity is the most common. It examines how much output is produced for each hour worked.
Productivity growth occurs when workers and businesses are able to produce more value using the same amount of labour, capital and resources.
This can happen through:
- Better technology.
- Improved skills and education.
- More efficient business practices.
- Better allocation of capital and labour.
- Increased innovation.
Consider two businesses employing the same number of workers for the same number of hours.
If one business can produce twice as much output because it uses superior technology or more efficient processes, that business is more productive.
At the national level, productivity growth allows wages and incomes to rise without requiring people to work longer hours. For this reason, economists have long regarded productivity as the most important driver of long-run improvements in living standards. [2],3
The Productivity Puzzle
Australia’s productivity data presents an intriguing picture.
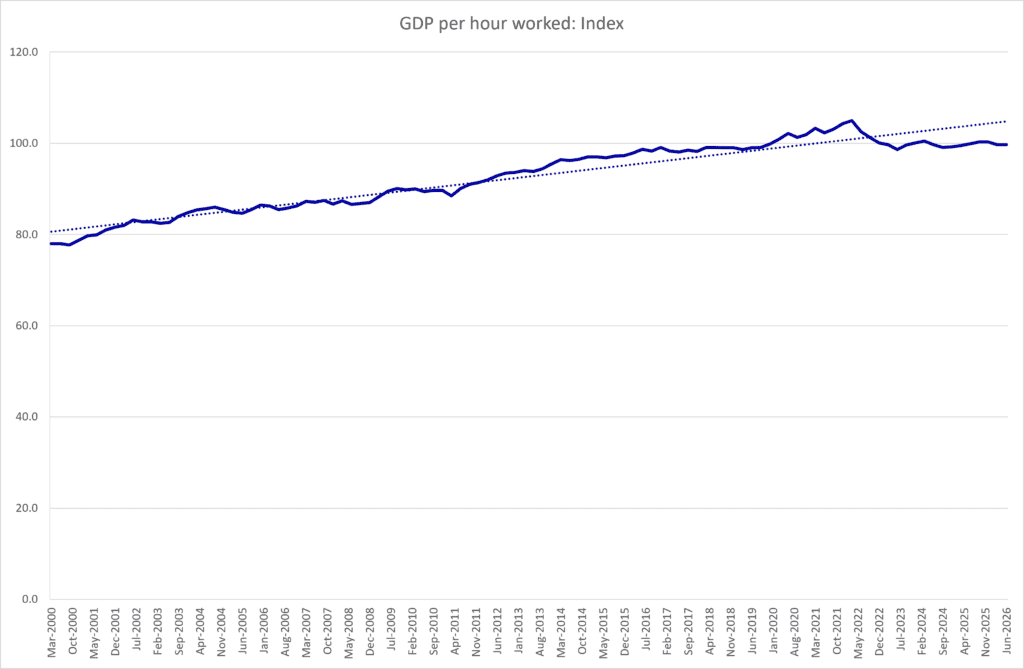
Labour productivity has risen over the long run, albeit more slowly than during the reform-driven productivity surge of the 1990s. [2] More recently, labour productivity experienced unusual movements during and immediately after the pandemic as patterns of work, employment and economic activity changed dramatically. [1]
Yet despite these gains, GDP per capita appears to have lost momentum.
This raises a fundamental question.
If productivity growth is the key driver of living standards, why has output per person slowed?
Is productivity growth weaker than it appears?
Has population growth diluted the gains?
Are businesses investing less effectively than they once did?
Or has something changed in the way Australia’s economy allocates labour and capital?
These questions form the basis of what I will call Australia’s productivity puzzle.
Understanding the answers matters because productivity is not merely an economic statistic. It influences wages, living standards, public finances and ultimately the prosperity available to future generations.
In the next article, we’ll explore why economists place so much emphasis on productivity, and why one famous observation remains as relevant today as when it was first written:
Productivity isn’t everything, but in the long run it is almost everything.[3]
Endnotes
- Australian Bureau of Statistics. (2026). Australian National Accounts: Key Aggregates. Australian National Accounts: National Income, Expenditure and Product, June 2026 | Australian Bureau of Statistics ↩︎
- D’Arcy, P., & Gustafsson, L. (2012). Australia’s Productivity Performance and Real Incomes. Reserve Bank of Australia Bulletin, June Quarter, 13-23. Australia’s Productivity Performance and Real Incomes | Bulletin – June 2012 | RBA ↩︎
- Krugman, P. R. (1994). The Age of Diminished Expectations: U.S. Economic Policy in the 1990s (Rev. ed.). MIT Press. ↩︎
Leave a Reply