
Part 3 of the Competition and Inflation Series
In the first article of this series, we examined whether greedflation was a useful explanation for Australia’s inflation surge. In the second, we explored how competition and market power can influence firms’ ability to raise prices.
Now it’s time to examine the evidence.
Rather than focusing on headlines or political arguments, this article looks at the financial statements of 12 major Australian listed companies across four sectors:
- Supermarkets
- Banking
- Insurance
- Energy
The question is simple: If companies used inflation as an opportunity to increase prices and profits, where should we expect to see it in the data?
The answer is more surprising than many Australians might expect.
Measuring Profit Expansion
Corporate profits can rise for many reasons. A company’s earnings may increase because:
- Revenue increases.
- Costs fall.
- Productivity improves.
- Commodity prices rise.
- Interest rates change.
- Profit margins expand.
For the greedflation debate, margin expansion matters most. A business that doubles revenue while maintaining the same margin tells a different story from a business that preserves revenue but substantially increases profitability.
To examine this question, we analysed financial statement data from major Australian companies across four sectors.
The Supermarket Story
Few industries attracted more public scrutiny during the cost-of-living crisis than supermarkets.
The Australian Competition and Consumer Commission‘s supermarket inquiry concluded that Coles Group Limited and Woolworths Group Limited increased product and EBIT margins during the inflation period.
Our analysis broadly supports that conclusion.
EBIT Margins
| Year | Coles | Woolworths | Metcash | Sector Average |
| FY2019 | 4.31% | 4.54% | 2.60% | 3.82% |
| FY2024 | 4.85% | 4.90% | 3.21% | 4.32% |
| FY2026 | 4.58% | 3.36% | 2.92% | 3.62% |
Financial statement analysis shows the supermarket sector’s average EBIT margin increased from approximately 3.8% before the inflation surge to a peak of around 4.3%.
That increase is real.
But it is also modest.
The sector’s average operating margin increased by approximately 0.5 percentage points, not several percentage points.
Net Margins
The net profit picture is even more restrained.
| Year | Sector Average Net Margin |
| FY2019 | 2.62% |
| FY2024 | 2.42% |
| FY2026 | 1.85% |
Rather than increasing dramatically, average net profit margins eventually declined.
This is not what most people imagine when they hear claims of runaway profiteering.
Looking Beyond Revenue
Another useful test is examining revenue growth after accounting for inflation.
Using ABS Consumer Price Index data, cumulative inflation across the period was approximately 24.6%. [abs.gov.au], [abs.gov.au], [rba.gov.au]
Real Revenue Growth
| Company | Real Revenue Growth |
| Metcash Limited | +9.6% |
| Woolworths Group Limited | -4.4% |
| Coles Group Limited | -6.1% |
Despite strong public criticism, two of the three major supermarket operators failed to generate revenue growth that exceeded inflation. This does not disprove pricing power. But it challenges the idea that supermarkets were the dominant corporate beneficiaries of Australia’s inflation episode.
The Banks
Australia’s major banks produced a different result. Higher interest rates improved profitability across the sector.
Return on Equity
| Bank | Pre-Inflation ROE | Peak/Post Inflation ROE |
| Commonwealth Bank of Australia | 10.85% | 14.62% |
| ANZ Group Holdings Limited | 7.59% | 10.53% |
| National Australia Bank Limited | 7.32% | 12.23% |
| Westpac Banking Corporation | 4.56% | 9.96% |
This represents a meaningful improvement in profitability. However, revenue growth tells a more restrained story.
For example, Westpac Banking Corporation’s operating income increased by only around 2.1% across the period, significantly below cumulative inflation. The banking story therefore appears less about explosive revenue growth and more about improving returns in a higher-interest-rate environment.
The Insurance Sector Surprise
One of the most interesting findings from the analysis comes from insurance.
Public attention largely focused on supermarkets, but insurers experienced some of the strongest profitability improvements in the dataset.
Return on Equity
| Company | Early Period ROE | Peak ROE |
| Insurance Australia Group Limited | 3.17% | 17.45% |
| Suncorp Group Limited | 5.68% | 12.15% |
| QBE Insurance Group Limited | 9.44% | 17.59% |
All three major insurers recorded substantial profitability improvements. There are legitimate reasons why this occurred:
- Rising catastrophe claims.
- Higher reinsurance costs.
- Severe weather events.
- Inflation in repair and replacement costs.
But the consistency of the profitability improvement across all three firms makes insurance one of the most important sectors to examine when discussing pricing power.
The Energy Windfall
The strongest profit expansion was clearly in energy.
Woodside Energy Group Ltd
Revenue increased from approximately $7.1 billion in 2019 to more than $20.8 billion by 2025. After adjusting for inflation, this represents real revenue growth of approximately 134%.
Santos Limited
Revenue and margins also increased substantially during the global energy shock. Unlike supermarkets, however, the explanation here is relatively straightforward. Global oil and LNG prices surged following the pandemic recovery and disruptions to international energy markets. Energy companies benefited from a global commodity shock. This is better described as a windfall profit story than a traditional greedflation story.
Ranking the Profit Winners
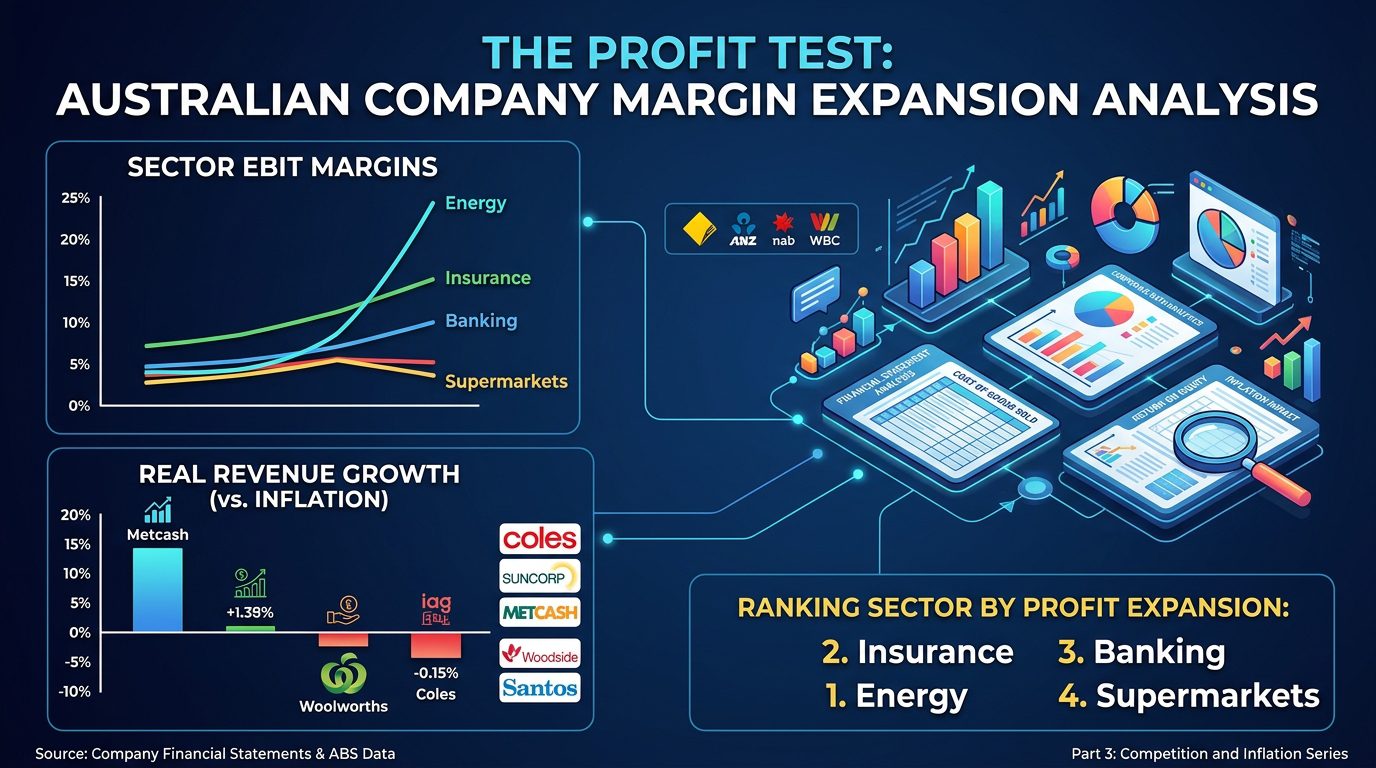
Based on the available financial data, the sectors can be ranked according to the strength of their profit expansion.
| Rank | Sector | Assessment |
| 1 | Energy | Exceptional revenue and profit growth |
| 2 | Insurance | Strong profitability expansion |
| 3 | Banking | Moderate profitability improvement |
| 4 | Supermarkets | Limited margin expansion |
This ranking differs substantially from much of the public discussion over recent years.
What Does This Mean for Greedflation?
The financial statements reveal a more complicated picture than either side of the debate often presents. The evidence shows:
- Some sectors expanded margins.
- Some sectors benefited from external shocks.
- Some sectors improved profitability despite weak real revenue growth.
- Supermarkets increased operating margins, but not dramatically.
The data does not support the idea that all large companies enjoyed similar profit gains during the inflation period. Instead, the experience varied significantly by industry. Different sectors faced different economic conditions, different competitive environments and different sources of profitability.
Conclusion
The financial statements suggest Australia’s inflation experience cannot be reduced to a single greedflation story.
Energy producers enjoyed extraordinary gains from global commodity markets. Insurers experienced significant profitability improvements. Banks benefited from higher interest rates. Supermarkets increased operating margins modestly while maintaining relatively low overall profitability.
If there is a lesson from the data, it is that inflation affected industries differently. The real challenge is not determining whether businesses sought profits. Businesses always do. The challenge is understanding which market conditions allowed some sectors to convert inflationary pressures into stronger profitability, while others did not.
In the next article, we’ll take a deeper look at Australia’s supermarket sector and compare company financial data with the findings of the ACCC’s supermarket inquiry.
Leave a Reply